Black Plastic: Is there a Viable Organic Mulch Alternative?

This article is an excerpt of an original post on the OMAFRA official website October, 2014 by Evan Elford – New Crop Development Specialist/OMAFRA.

Black plastic mulch is widely used in the production of vegetable crops due to its effectiveness as a weed barrier, capability to conserve soil moisture and ability to warm soil temperatures in spring. Although it is permitted in organic production, the question of using a product which creates non-biodegradable waste is of concern to many organic producers. Early forms of biodegradable films were developed to address this concern, however due to poor performance in early years and restrictions on starch based feed stocks (e.g. Genetically Modified Organism starch) by organic regulations, many producers continue to use plastic mulch. The quality of biodegradable films has improved in recent years but growers and researchers are still exploring other options for organic farms, including organic no-till systems, in order to find management strategies that benefit the whole biological system.

Research supporting organic no-till options for vegetable crops is still in early development. The system is termed ‘no-till’ but it should be clarified that it is actually a rotation based on reduced tillage and the use of cover crops to build soil health and manage weeds. The Rodale Institute located in Pennsylvania, USA outlines three fundamentals of organic no-till: “1) soil biology powers the system, 2) cover crops are a source of fertility and weed management, and 3) tillage is limited and best described as rotational tillage.” (Feeser et al., 2014). In 2009, the Rodale Institute received funding to study alternative no-till options to black plastic mulch in vegetable crop production systems.

The treatments investigated during the study were based on cover crops which were terminated with one of three methods: a) tilled one month prior to application of black plastic mulch; b) use of a roller-crimper; or, c) mowed. Tomatoes were the representative vegetable crop used in the replicated studies. Figure 1 outlines the 9 mulch and termination treatments used in the study.
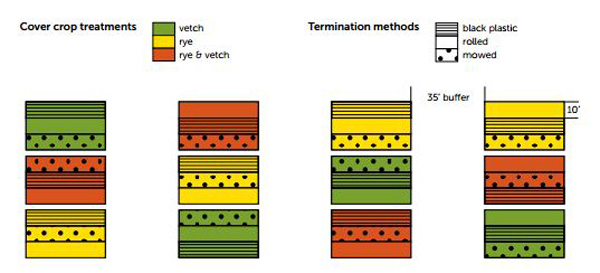
Graphic of mulch and termination treatments used in the study. Cover crop treatments include vetch, rye and rye & vetch and termination methods include black plastic, rolled and mowed.
Figure 1 (from Feeser et al., 2014): Cover crop treatments used for organic no-till vegetable crop study consisting of vetch cv. ‘Purple Bounty’ planted at 39 kg/ha; rye cv. ‘Aroostook’ planted at 188 kg/ha; and rye-vetch mix planted at 106 kg/ha (78 kg rye:28 kg vetch).

Data on weed biomass, tomato yields (total and marketable), cover crops (biomass, carbon input and nitrogen input), soil moisture, soil temperature and other parameters were collected in each of the three years of the study. Weed biomass and tomato yields will be the focus in the remainder of this article.

Weed Biomass

Weed Biomass was recorded four weeks after tomato planting in each of the three years. Data recorded in 2010 and 2012 were taken in the planting bed and in paths between beds, whereas data recorded in 2011 were only taken in the planting bed. Variable results were observed across the three years, possibly due to differences in data collection methods as well as environmental effects. Overall, the black plastic mulch treatments were the most consistent in supressing weeds. However, the rye/vetch mix and individual rye and vetch cover crops terminated with rolling performed better than the cover crop treatments terminated with mowing.

Yield

Tomato yields were recorded once or twice per week as harvest dictated through the growing season. Only total yields were recorded in 2010 and the highest yields were obtained in rolled and mowed treatments of all organic mulch types.

In 2011 and 2012, total yields and marketable yields were recorded. Marketable yields of tomatoes were approximately 20% lower than total yields in the 2011 growing season. The highest marketable yields were obtained in black plastic mulch treatments followed by the rye/vetch mixture that had been rolled or mowed. Marketable yield in the rye/vetch mixture (rolled or mowed) was approximately 70% of the black plastic mulch marketable yield.

In 2012, severe late blight reduced marketable yield to 23% of total yield across most treatments. Vetch treatments terminated by rolling or mowing exhibited the lowest yields of all treatments. No significant differences were observed between the other treatments.

Summary

Results were variable over the three years of this initial study and therefore a longer term analysis should be considered for organic mulch treatments.

Initial outcomes from this study suggest that organic mulch mixtures (e.g. vetch/rye mixture) terminated through rolling may provide a reasonable alternative to black plastic mulch for weed management in most years.

In order to obtain acceptable weed control, the Rodale report suggests using cover crops that produce 6.5-9 tonnes of dry matter per hectare in order to have enough biomass for weed suppression after termination. Additionally, cover crops with a Carbon-Nitrogen ratio of 20:1 or higher should be considered as they will break down more slowly, thus providing longer weed suppression through the growing season.

References

Feeser, J., Zinati, G., and Moyer, J. 2014. Beyond Black Plastic: cover crops and organic no-till for vegetable production. Pennsylvania, USA: Rodale Institute.

Posted in Crops, organic, Soil | Tagged , , , | Leave a comment

Flea Beetles on Crucifer Crops

Originally posted on ONvegetables.com on May 15, 2013 by Marion Paibomesai – Vegetable Crops Specialist/OMAFRA.

Flea beetle activity in brassica crops has been reported in several areas (11 June 2014).

What species of flea beetles affect crucifer crops in Ontario?

Two species of flea beetles that commonly feed on brassica crops in Ontario are the crucifer flea beetle (Phyllotreta cruciferae) and striped flea beetle (Phyllotreta striolata). There are reports that the crucifer flea beetle is more common in Ontario than the striped flea beetle.

Biology of flea beetles

In Ontario, both flea beetles have one generation per year. Adults overwinter in soil and leaf litter and become active the following spring (usually in May). Striped flea beetles typically become active two weeks earlier than the crucifer flea beetle, but you can usually find these species co-existing in the same field. Soon after the beetles become active in the spring, they lay eggs in soil near host plants. These eggs hatch in about 5 days and the larvae undergo three instars (or stages) followed by pupation in the soil. Adults emerge in July and feed until they need to seek hibernation sites in the fall to overwinter. In hot, dry weather (ideal conditions), development from egg to adult can take place in as little as 7 weeks, as such there is the potential for 2 generations per year here. Flea beetles will also consume cruciferous weed species. Sunny, warm, dry conditions are ideal conditions for flea beetle feeding. Feeding activity decreases when conditions are cool and damp.

How do you identify flea beetles?

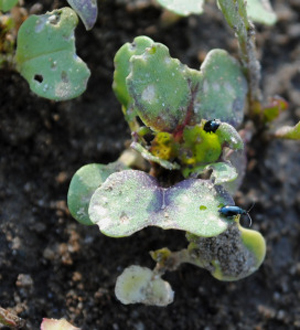
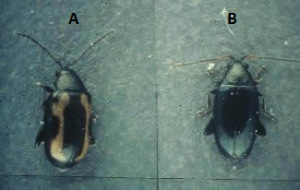
Flea beetles are small, 2-3 mm long, shiny black beetles with strong hindlegs. When you approach plants infested with flea beetles, the beetles will jump away quickly. When you see this behaviour you can understand why they are called “flea” beetles. The striped flea beetles are brownish-black in colour with yellow stripes down their backs (Figure 1A). Crucifer flea beetles are black and very shiny (Figure 1B). In Figure 2, a crucifer flea beetle can be seen sitting on a leaf of a Brassica crop.

Comparison of striped flea beetle and crucifer flea beetle.
Figure 1. Striped flea beetle (A) and crucifer flea beetle (B) adults.
Crucifer flea beetle sitting on brassica crop cotyledon.
Figure 2. Crucifer flea beetle sitting on brassica crop cotyledon.

What does flea beetle feeding damage look like and how does it affect the plant?

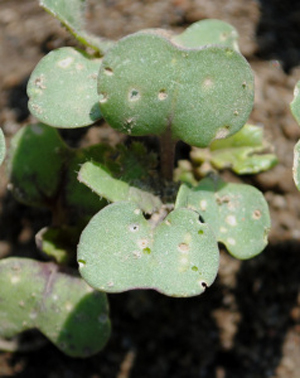
Feeding damage is described as small round holes or ‘shot-holes’ on the leaves of crucifer crops. Older feeding holes may be ringed with dried, brown tissue, while newer feeding holes are surrounding by green tissue (Figure 3; you can see both old and new damage on these young leaves). Damage may also appear as small pits on the leaves. Flea beetles can cause enough foliage damage to seedlings resulting in death. Direct-seeded crops and young tender transplants are quite susceptible to damage. Brassica transplants seem to be less susceptible to flea beetle damage compared to direct-seeded crops and these beetles prefer specialty Brassica crops, like Chinese cabbage, bok choy, compared to the ‘traditional’ cole crops (broccoli, cabbage, cauliflower). Plants can tolerate no more than one flea beetle per plant up to the 6th leaf stage. Generally, after the 6th leaf stage there is enough leaf tissue that plants can tolerate damage, which may otherwise interfere with growth at earlier crop stages.

Flea beetle feeding damage on brassica crop cotyledon.
Figure 3. Old and new flea beetle feeding damage on brassica crop cotyledons. Old damaged is ringed with brown, dried leaf tissue. Newer damage has green edges.

Management options for flea beetles

Use transplants, if possible. Flea beetles can cause significant damage on seedlings of direct-seeded crops. Using transplants can give you head start against flea beetles. Control cruciferous weeds to reduce potential feeding sites in the spring.

Floating row covers may help, but keep in mind that crop rotation is important. If you are planting in the same area of the field that had crucifer crops last year, the flea beetles could potentially be trapped with your crop under the row cover this spring. Row covers need to be installed with sealed edges soon after planting to prevent infestations of flea beetles. Row covers may interfere with growth of cole crops. Be sure to check under the covers for the presence of flea beetles (and other pests) and to see how your crop is growing under cover.

Pest control products may help manage populations of flea beetles. When scouting, inspect 25 plants throughout the field. For newly emerged or transplanted crops, you may need to check the fields every couple days, as flea beetles can cause significant damage during this stage the crop. Flea beetles will try to jump away when you are walking through the crop, so try to make counts as you approach the plants. Record the number of beetles on each plant and divide by 25 to calculate the average number of beetles per plant. Make notes on the feeding damage caused by flea beetles, as well. In terms of treatment thresholds, up to the 6-leaf stage, plants can tolerate no more than 1 flea beetle per plant; however, feeding damage incurred in later growth stages may negatively impact the quality and thus the marketability of the crop (this is particularly a concern for the ‘leafy’ brassica vegetables).

Crop protection information is now available through the Ontario Crop Protection Hub for more information on pest control products registered for flea beetles. Always follow directions for use and precautions on the product label. Check with your certification body before making a pest control product application. More information on flea beetles is available on Crop IPM.

Posted in Crops, pests | Tagged , , | Leave a comment

Guardian Network Website Launched

The Canadian Mental Health Association (CMHA), Ontario has launched the latest initiative in a suite of programs focused on agriculture wellness in Ontario. The Guardian Network is a volunteer-driven community-based suicide prevention network to support the well-being of Ontario’s farmers. CMHA Ontario is currently training volunteers from within the agricultural community to learn how to recognize mental health concerns and access appropriate supports.

To find out how you can become a Guardian or to learn more, visit: GuardianNetwork.ca

This project is provided with funding by the governments of Canada and Ontario, including support from the Canadian Agricultural Partnership, a five-year federal-provincial-territorial initiative.

With The Guardian Network, Farmer Wellness Initiative, and In the Know, CMHA Ontario and our partners are working to ensure the ongoing well-being of Ontario’s farming community.

banner promoting Guardian Network website

Posted in Uncategorized | Leave a comment

Organic Dairy Production in Ontario

Organic dairy production is a system of farm design and management practices for producing milk, yogurt, cheese, cream and other dairy products without the use of pesticides, synthetic fertilizers or antibiotics. For some producers, organic dairy production can be a good fit. 

There are many factors to consider before making the transition to organic dairy production, including:

  • current and future milk demand
  • standards
  • certification requirements
  • production costs
  • lifestyle goals

Read more about organic dairy production in Ontario in OMAFRA’s factsheet.

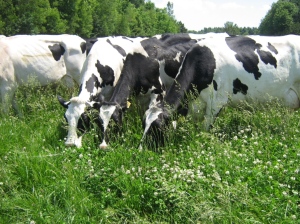
Cows on pasture
Posted in Livestock, organic | Tagged , , | Leave a comment

Farmer Wellness Initiative

The Farmer Wellness Initiative offers farmers across Ontario and members of their household access to free counselling sessions with a mental health professional. The mental health professionals have received training to understand the unique needs of Ontario farmers. Accessible 24 hours a day, 7 days a week, 365 days a year, in English and French, farmers can call 1-866-267-6255 to speak to a counsellor. This service is provided by LifeWorks.

The Farmer Wellness Initiative is supported by the Canadian Mental Health Association-Ontario Division, in partnership with the Ontario Federation of Agriculture, and aims to protect and enhance the mental well-being of farmers and their families. This initiative is funded by the governments of Canada and Ontario, and through the Canadian Agricultural Partnership (the Partnership), a 5-year federal-provincial-territorial initiative.

This program will provide valuable support for the agricultural community by giving farmers easy access to a comprehensive network of mental health counselling and crisis services. Together, we can break the silence. Please visit the Farmer Wellness Initiative website to learn more.

Promotional image for the Farmer Wellness Initiative. Features logo stating "Farmer Wellness Initiative," phone number "1-866-267-6255" and availability as 24/7/365.
Posted in Resources | Tagged | Leave a comment

Is the yield potential of alfalfa increasing?

The relationship between alfalfa breeding efforts and yield potential is complicated. While most literature on annual grain crops shows yield improvements with the release of new varieties over time, a literature search on alfalfa yield will show improvement, stagnation, and declines, depending on the paper. One of the latest attempts to discern what is really going on comes from Lei Ren and colleagues out of the University of Saskatchewan.

Ren and colleagues summarized data from the Western Forage Variety Testing System from 1997 to 2011 to see how breeding has changed the yield potential of alfalfa varieties over time. They recognized that environmental conditions and harvest management are factors that can affect alfalfa yield that are not always included in reviews on this topic. Since the prairies receive significantly less annual precipitation than Ontario, the data from the irrigated sites in the Western Forage Variety Testing System are of particular interest in eastern Canada.

The researchers found no significant trends between forage yield and the year a variety was released when they examined the data from irrigated sites for varieties released between 1997 and 2011. There was also no significant improvement in regrowth for second cut. However, when they restricted their analysis to varieties released between 2000 and 2011, second cut yields and total yields (first plus second cut) improved about 1% per year across the two irrigated sites. This stronger regrowth could be the result of reduced fall dormancy in newer varieties.

In addition, the cumulative temperature above 5˚C from April to June had a significant impact on alfalfa yield at the irrigated sites. This makes sense, since growing degree day models (Base 5˚C) can predict alfalfa development with reasonable accuracy. Warmer temperatures above 5˚C would speed up alfalfa development in the spring and allow for more first cut growth. The amount of precipitation between April and June at rain-fed sites had a significant impact on yield. This trend was not apparent at the irrigated sites because water was not limiting in those plots.

The irrigated sites had a more aggressive cutting schedule (three cuts/year) than many of the rain-fed trial locations (one to three cuts/year). Trial data showed that yields from stands that were harvested more frequently were not as affected by precipitation during the growing season. The researchers attributed this to reduced vigour because of stress from frequent cutting. A weakened plant with a reduced root system is less able to take advantage of moisture following a rain. Increased snow cover during the winter increased alfalfa yield on the irrigated sites. While it is known that snow cover helps protect alfalfa crowns from cold injury, this relationship may be more significant when the plants are stressed from aggressive cutting schedules.

It is worth keeping in mind that the variety trial sites all have good soil fertility to support alfalfa production. Any responses to limited or unbalanced nutrition will not be apparent from this data set. How different varieties cope with nutritional stresses is another management factor that could influence alfalfa yield.

Other work on this topic can provide more context for the inconsistent conclusions around alfalfa breeding and yield potential. In a field study from 1999 to 2003, Lamb and colleagues assessed the yield of alfalfa varieties released between 1940 to 1995. Plots were established in Wisconsin, Ohio, Minnesota, and Iowa. While the sites in Minnesota and Iowa showed little yield advantage to using newer varieties, there was a significant yield difference between older and newer varieties in Ohio and Wisconsin. Stand persistence was also significantly better for newer varieties in these states. This was attributed to the improved disease resistance in newer varieties and the environmental conditions in Ohio and Wisconsin that increased disease pressure.

With environmental factors playing such a strong role in the yield potential of alfalfa, there is not a universal answer to whether breeding has improved alfalfa yields. In addition, alfalfa breeders have selected for multiple traits – such as winterhardiness, yield, persistence, and quality – simultaneously, even though these traits sometimes work against one another. Right now, it is only when growing conditions allow improved traits to shine that genetic advancements appear in the yield data. However, in wetter environments like Ontario’s, newer varieties show improved regrowth and disease resistance. Both traits contribute to higher yields and persistence. Therefore, Ontario producers can benefit from growing newer varieties on their operations. Purchasing certified seed ensures that desirable traits are present in the alfalfa to be seeded on the farm.

References

J.F.S. Lamb, C.C. Sheaffer, L.H. Rhodes, R.M. Sulc, D.J. Undersander, and E.C. Brummer. 2006. Five decades of alfalfa cultivar improvement: impact on forage yield, persistence, and nutritive value. Crop Science. 46(2):902-909.

L. Ren, J.A. Bennett, B. Coulman, J. Liu, and B. Biligetu. 2021. Forage yield trend of alfalfa cultivars in the Canadian prairies and its relation to environmental factors and harvest management. Grass and Forage Science. 76:390-399.

Posted in Crops | Tagged , , | Leave a comment

Organic Quick Facts

According to the Canadian Organic Trade Association (COTA), Canadians spent nearly $8.14 billion on organic products in 2021.

Each year, COTA releases a report detailing trends in Canada’s organic agriculture industry. The full Canadian Organic Market Report is available for purchase online from COTA. Similarly, the annual Organic Agriculture by the Numbers releases provide information on organic operators and acreage trends and are available for download.

COTA additionally releases free Quick Facts About Organic in Canada infographics for download that outline annual facts and figures obtained from their research. Use these resources to keep up to date with trends in organics and explore Canada’s organics industry.

Posted in organic, Resources | Tagged , | Leave a comment

New Website Launched for Canadian Small Scale Pig Farmers

Originally posted on ONswine.

Recently a new website dedicated to Canadian small scale pig farmers was launched. The site is designed to provide relevant, factual, resources needed to be successful in raising pigs on small farms. The information on the site is the result of a collaborative effort which included Canadian small scale pig farmers, veterinarians and swine experts from across the country.

Read the full article.

Posted in Livestock | Tagged | Leave a comment

Grass Growth Rates and Pasture Management

One of the unique challenges of pasture management is that the crop is both growing and being harvested (through grazing) at the same time for most of the cropping year. Matching animal demand to pasture supply is an important management skill to make the most of the available pasture and ensure good animal performance. Understanding grass growth rate is critical in successfully matching demand with supply.

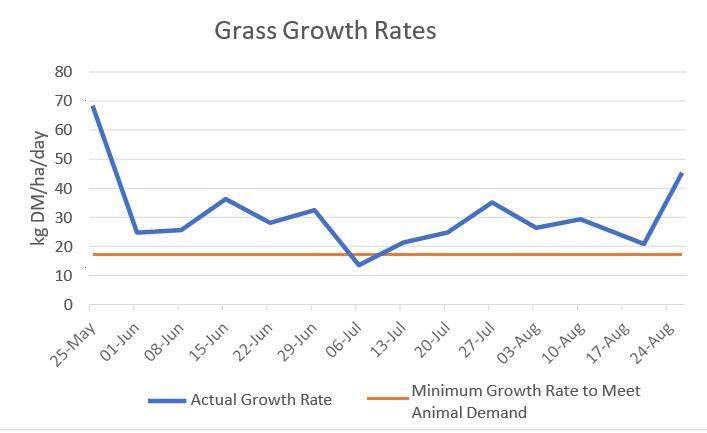
Only occasionally do grass growth rate and animal demand align perfectly. More often, grass growth rates either exceed or fall short of daily dry matter demand (Figure 1). In Ontario, grass growth rates in the spring are typically very high and grow much faster than livestock can eat it. When growth rates exceed demand, pastures near the end of the rotation will become severely overgrown, leading to poor pasture utilization and poor animal performance. However, in the summer, hot and dry conditions and grass maturity bring daily growth rates down to near zero and can cause a grass deficit. Without planning during times of slow grass growth, the manager may run out of pasture to feed their livestock.

Graph comparing the minimum grass growth rate required to meet animal demand with actual growth rates from a pasture in Kawartha Lakes in 2021
Figure 1. Grass growth rates from a pasture in Kawartha Lakes, ON in 2021

Pasture managers can determine the minimum grass growth rate required to feed their herd or flock. Producers who track grass growth rates and compare them to their minimum required rate can make proactive management decisions to avoid running out of pasture.

Determine Animal Demand

The first step is to know how much forage dry matter the livestock need to eat every day.

For dairy animals, work with your nutritionist to determine the target dry matter intake. Then decide what proportion of this target should come from pasture. For example, Canadian organic standards require that at least 30% of an animal’s diet should come from pasture during the grazing season.

For all other classes of livestock, estimate the total dry matter intake based on a percent of body weight (BW). Use the average body weight for the group, then multiply by the intake percentage for that class of livestock from Table 1.

Livestock ClassForage Dry Matter Intake
(% BW/day)
Forage Dry Matter Intake
(decimal; multiply this by BW)
Beef, cow3.0%0.03
Beef, finishing3.0%0.03
Beef, replacement heifer3.0%0.03
Beef, backgrounder3.0%0.03
Bull2.6%0.026
Goat, kid3.0%0.03
Goat, meat breed doe2.5%0.025
Horse2.5%0.025
Sheep, lamb3.0%0.03
Sheep, meat breed ewe2.5%0.025
Table 1. Forage dry matter intake as a percentage of animal body weight

Either of the above methods will give you a daily animal dry matter intake in lbs (or kg).

Factor in the Land Base

The other factor influencing animal demand on the pasture is the stocking rate. Stocking rate is the average annual number of animals kept on an area of land. To calculate stocking rate, divide the number of animals in the group by the total area they have for grazing. This will give you an average number of animals per acre (or hectare).

Calculate Minimum Grass Growth Rate

To work out the minimum grass growth rate to keep up with animal demand:

  1. Determine daily animal dry matter intake as described above for dairy or non-dairy animals.
  2. Divide the number of animals by the total pasture area to determine stocking rate.
  3. Multiply daily animal dry matter intake by stocking rate to get minimum grass growth rate.
Sample Calculation – MetricSample Calculation – ImperialYour Calculation
Class of AnimalsBackgroundersBackgrounders
Average Body Weight340 kg750 lbs
Dry Matter Intake (decimal from Table 1)x 0.03x 0.03
Daily Forage Dry Matter Intake/Animal= 10.2 kg DM/head/day= 22.5 lbs DM/head/day
Number of Animals50 animals50 animals
Pasture Area÷ 16 ha÷ 40 acres
Stocking Rate= 3.1 animals/ha= 1.25 animals/acre
Daily Forage Dry Matter Intake/Animal10.2 kg DM/head/day22.5 lbs DM/head/day
Stocking Ratex 3.1 animals/hax 1.25 animals/acre
Minimum Grass Growth Rate= 32 kg DM/ha/day= 28 lbs DM/acre/day
Table 2. Example Calculations for Minimum Grass Growth Rates

This number provides a minimum grass growth rate required to keep up with animal demand. If the actual grass growth rate falls below the minimum needed, the pasture will run out of grass unless growth rates improve again soon, or management intervenes.

Managing Through Slow Growth Rates

To avoid running out of grass, managers need to slow down the rotation (i.e., lengthen the rest period for the grass). There are a few ways to achieve this, and the right option depends on the severity of the shortfall and the farm’s unique circumstances. Options to slow down the rotation include finding additional acres to graze, feeding supplemental forage, and reducing animal demand.

Find additional acres to graze

Taking a flexible approach to grazing management starting at turn-out can provide additional acres as growth rates slow. In spring this means dedicating a smaller area to grazing, and cutting the rest to store as hay, baleage or grass silage. With fast spring growth rates, the cut pasture will be able to regrow in time for grazing in the next rotation. This option can provide livestock with a continuous supply of high- quality feed and reduce the risk of running out of pasture.

Additional acres could be brought into the grazing platform by renting more pasture or grazing annual forages (cover crops) or grain stover.

Feed supplemental forage

Research shows that producers feed less stored forage if they start supplementing on pasture before livestock run out of grass. Since livestock are getting some of their nutrition from the hay, this allows for slightly longer graze periods in each paddock and longer rest periods for the whole pasture. Waiting to feed stored forage for when the pasture has run out of grass results in feeding more forage overall, which is costly.

Reduce Animal Demand

While the first two options help increase grass supply, reducing demand for grass is another approach to align growth rates with animal needs. Weaning young stock early can lower demand, since their dams will stop milking shortly thereafter and require less feed. Culling open animals, or animals with other undesirable traits results in fewer mouths to feed. Selling young stock early can also lower animal demand on the farm.

Getting the Data

Producers who track grass growth rates and compare them to their minimum required rate can make proactive management decisions to maximize pasture and animal performance. Research is underway in Ontario to make measuring pasture easy to do on farm. Until that project is complete, producers grazing near one of the research sites may be able to use the growth rate data shared on Twitter with #grazingON.

Posted in Crops, Livestock | Tagged , | Leave a comment

Organic Pork Production in Ontario

Consumer demand for organic pork is rising. Some pork producers may wish to capture part of this market.

It is estimated that there are about 45 certified organic pork producers in Ontario with a total annual production of approximately 24,000 market hogs. Certified organic hogs produced in Ontario are marketed to processors in Ontario, Quebec and the U.S. Current information shows that, in Ontario, certified organic pork operations range in size from 5 to 300+ sows for farrow-to-finish operations.

Read more about Organic pork production in Ontario in the OMAFRA factsheet.

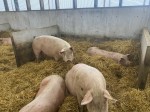
Pigs on straw
Posted in Livestock, organic | Tagged , , | Leave a comment